

Home Prices Rose Up to 74% During Covid. Here's How Much They've Fallen Since in Hamilton, Burlington and Oakville
Written by Daniel Zareh, REALTOR® — licensed since 2006, serving Hamilton, Stoney Creek, Grimsby, Burlington and Oakville.
Last reviewed October 21, 2026, updated October 23, 2026. Every figure below was checked against its source on October 21.
You've probably seen the headlines. Prices are "crashing." Prices are "down 37%." Depending on who you follow, it's either the deal of a lifetime or the start of something worse.
I wanted a straight answer for our three markets. So I pulled the median sale price at three points: right before Covid, at the 2022 peak, and today.
Here's what the numbers actually say.
The short version
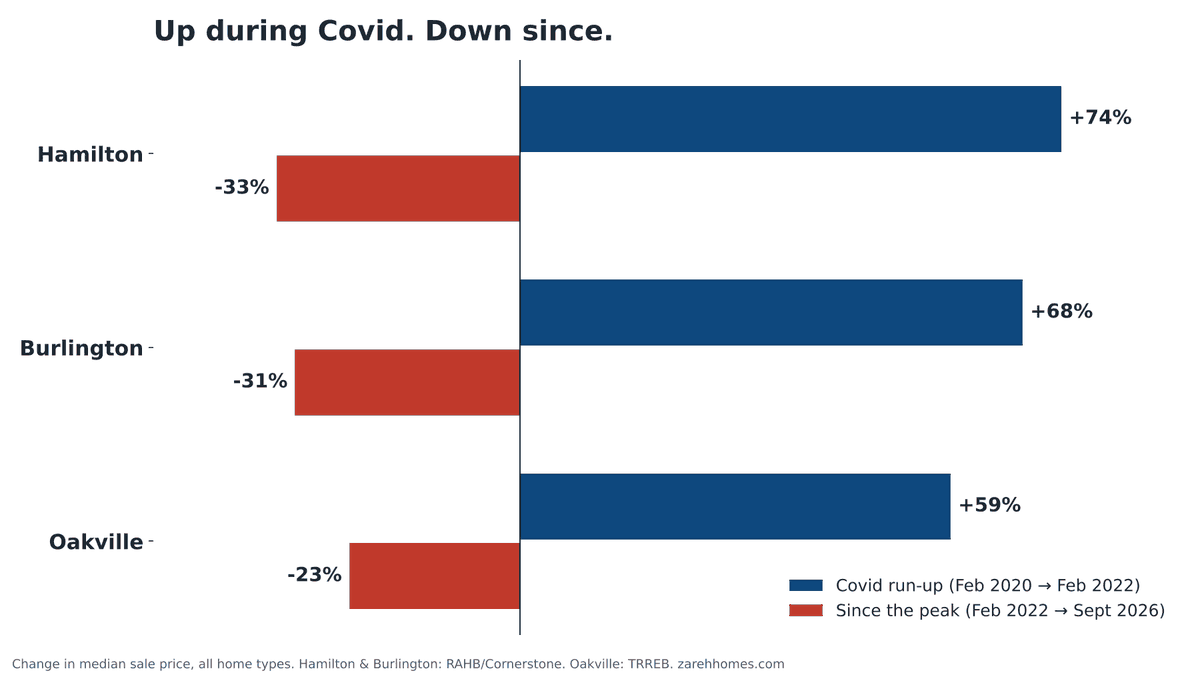
- Hamilton: up 74% during Covid, down 33% since the peak.
- Burlington: up 68% during Covid, down 31% since the peak.
- Oakville: up 59% during Covid, down 23% since the peak.
Big swings both ways. But here's the part most posts leave out: in every city, prices are still higher than they were before Covid.
The numbers, city by city
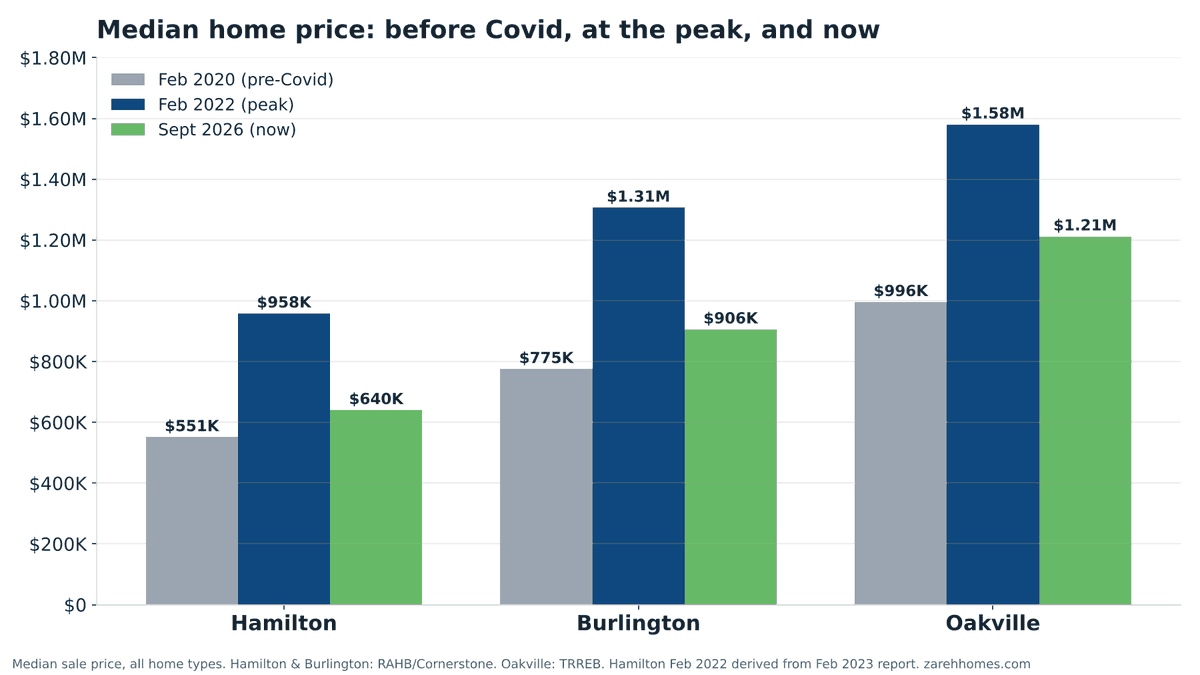
| Median sale price | Feb 2020 (pre-Covid) | Feb 2022 (peak) | Sept 2026 (now) |
|---|---|---|---|
| Hamilton | $551,000 | ~$958,000 | $640,000 |
| Burlington | $775,000 | $1,306,000 | $905,500 |
| Oakville | $995,500 | $1,580,000 | $1,211,500 |
Hamilton
The median went from $551,000 to about $958,000 in two years. That's roughly $407,000 added to a typical home.
Since then it's given back about $318,000. Today's median is $640,000.
So a typical Hamilton home is still about $89,000 above where it sat before Covid. That's up 16%.
Burlington
Burlington ran from $775,000 to $1,306,000. That's $531,000 in two years.
It's given back about $400,000 since. Today's median is $905,500.
Net, that's still about $130,000 above pre-Covid. Up 17%.
Oakville
Oakville went from $995,500 to $1,580,000. It actually kept climbing into March 2022 and topped out at $1,650,000. Measured from that true top, it's down 27%.
Today's median is $1,211,500. That's still about $216,000 above pre-Covid, up 22%. Oakville held up the best of the three.
One thing worth knowing if you own there. Oakville also has roughly 62,800 homes somewhere in its planning pipeline against a 33,000-by-2031 target, and it started only 2,104 of them last year. That approved supply doesn't threaten every Oakville home equally, and I went through which ones it does in this piece on Oakville's pipeline versus its target.
What it averages out to over the whole cycle
This is the part I think matters most.
If you bought before Covid and you're still in the home today, you didn't ride a 74% gain and a 33% loss. You rode the net.
Spread over the six and a half years from February 2020 to today, it works out to roughly:
- Hamilton: about 2.3% a year
- Burlington: about 2.4% a year
- Oakville: about 3.0% a year
That's a normal, boring number. The run-up and the drop mostly cancelled each other out.
Now add inflation
This is where it gets interesting.
Prices across the board have risen about 24% since February 2020, based on Statistics Canada's consumer price index. So $551,000 back then is worth about $682,000 in today's dollars.
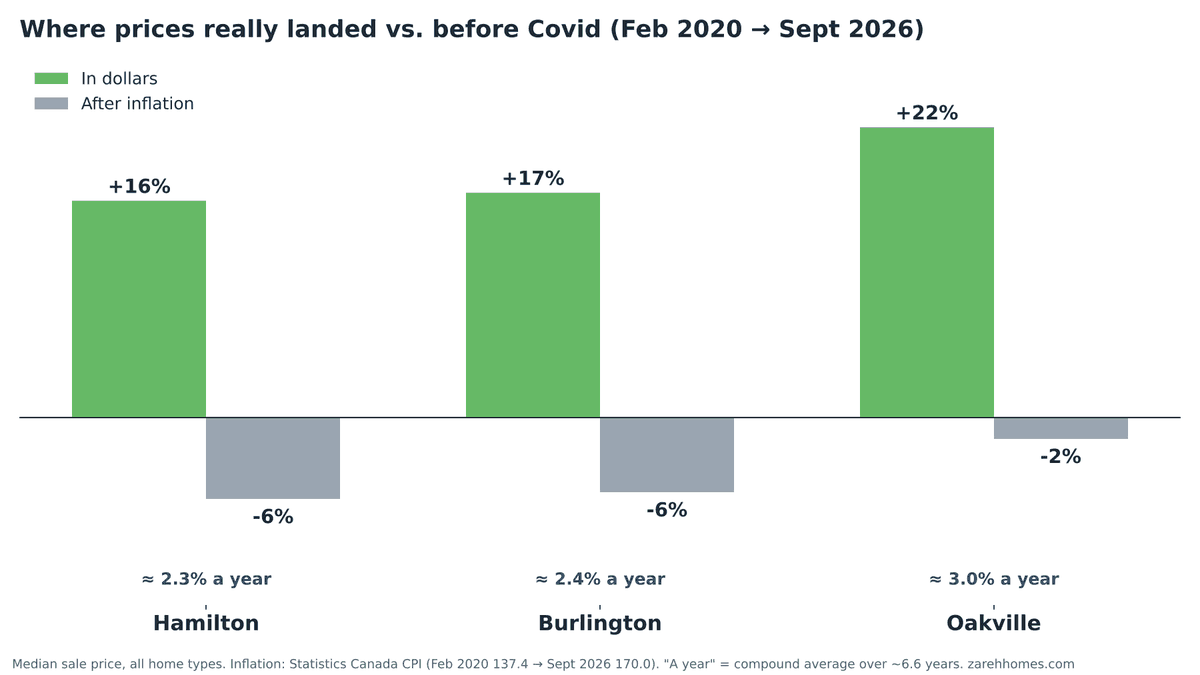
Measured that way, today's median is:
- Hamilton: about 6% below pre-Covid in real terms
- Burlington: about 6% below
- Oakville: about 2% below
In plain terms, homes in all three cities cost about the same as they did before Covid, once you account for everything else getting more expensive. Hamilton and Burlington are a little cheaper.
What this means if you're buying
You're not buying at the top. You're buying at roughly pre-Covid value in today's dollars, with more choice and more room to negotiate than anyone had in 2021.
That doesn't mean prices can't slip further. Nobody can call the bottom, and I won't pretend to. But at the end of the day, the 2022 premium is mostly gone.
What this means if you're selling
If you bought before 2020, you're very likely still ahead. If you bought between late 2020 and mid-2022, the math is tighter, and the right list price matters more than ever.
Either way, the number that matters is what your street and your type of home are doing right now, not a citywide median.
How I got these numbers
- Median sale price, all home types. It's the middle sale of the month, so it isn't pulled around by a few very high or very low sales the way an average is.
- Hamilton and Burlington: RAHB / Cornerstone Association of REALTORS® board data. The Hamilton February 2022 figure is worked out from the board's February 2023 report ($750,000, down 21.7% year over year), so it's accurate to within about $1,000.
- Oakville: TRREB Market Watch, Halton Region, Oakville. Oakville's board moved onto TRREB's system in 2025, so the reporting coverage today may not match 2020 and 2022 exactly.
- Inflation: Statistics Canada CPI, all items, Canada (February 2020: 137.4, February 2022: 146.8, September 2026: 170.0).
- These are monthly numbers and aren't seasonally adjusted. September is a slower month than February usually is, and the mix of homes that sell changes month to month. Use this as the big picture, not a price for your specific home.
For this month's numbers broken down by area and property type, see my September 2026 market update. For Oakville specifically, here's what's approved there versus what's actually getting built.
Your street, not the citywide median
Citywide numbers tell the story. Your street tells the price.
If you want, we can go through it quickly together. I'll show you where your home or the area you're looking at sits against these numbers. Won't take long.
➣ Search Hamilton homes on the live map
➣ Search Burlington homes on the live map
➣ Search Oakville homes on the live map
Daniel Zareh is a licensed REALTOR® with over 20 years of experience serving Hamilton, Stoney Creek, Grimsby, Binbrook, Beamsville, Burlington, Oakville and Mississauga. Market figures are from RAHB/Cornerstone and TRREB monthly reports; inflation from Statistics Canada.
Want to know where your home lands?
Citywide numbers tell the story. Your street tells the price. Send me a note and I'll show you where your home, or the area you're looking at, sits against these numbers.